








The truth math behind what drives ACV, win rate, cycle time
Connecting your CRM to an LLM gets you an opinion, built on a language model that predicts what you want to hear.Olli’s built on a deep ML layer that’s specifically focused on the regression and multivariate analysis to get you numbers you can trust — while taking action on what it reveals. No more data disconnected from execution.
See the deals that need you, now.
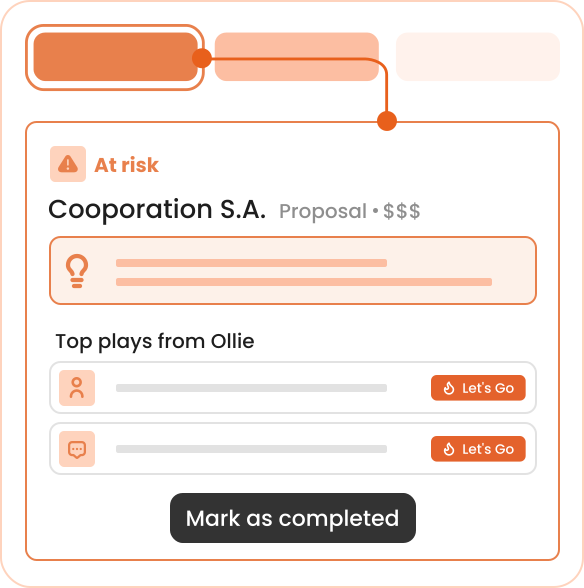
Heatmaps for where the at-risk pipe is concentrated. Stage by stage. Rep by rep. Segment by segment.Including the deal that's about to slip before the rep notices, with the top plays Olli’s proposed and is ready to execute.
Close skills gaps before they become quota gaps.
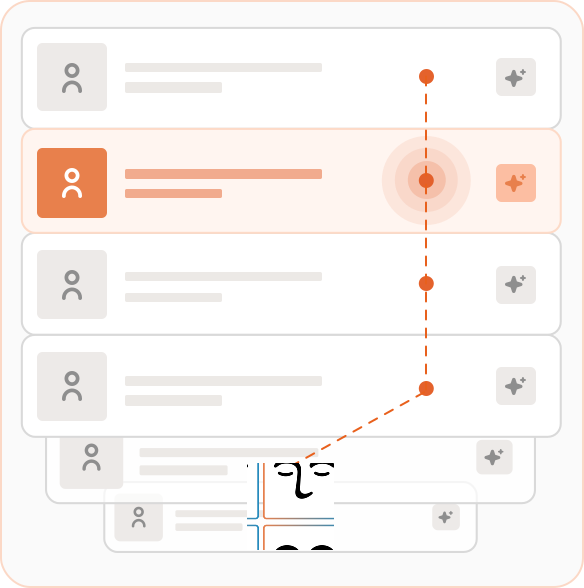
Patterns across the team like discovery depth by rep, multithreading breadth, and executive engagement:
Your middle-of-the-pack reps climb faster when you can see exactly where they're falling off, and what Olli’s already been doing to enable them.
The patterns nobody had time to find.
Why your win rate dropped in mid-market last quarter. Which competitor is showing up in stage 3 more often than last year. The new objection that's killing deals at procurement.All the work a chief of staff would do, building the picture nobody had time to draw.
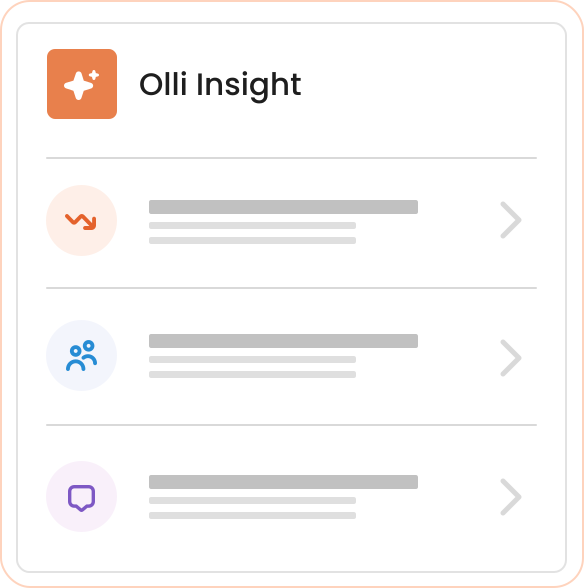
What leaders see when the model connects the dots.
Deal trajectories, coaching gaps, hidden risks, and emerging patterns, rolled into one continuously updated picture of the business.

Slack and email digests on whatever cadence you set

Pattern detection on objections, competitors, and deal blockers

Deal trajectory views (stage velocity, multithreading depth, engagement)

Olli's impact tracked on ACV, win rate, and cycle time

Skill-gap rollups across the team

Heatmaps for at-risk pipe by rep, segment, and stage
Got questions? We got you.
Scan some quick answers here, or book a time to chat 1:1
Yes. Default views ship for CRO, VP Sales, VP Enablement, and VP RevOps. All views customizable. Custom KPIs, custom filters, custom Slack and email digests.
For most teams, yes. The QBR rollup Olli builds nightly covers ACV, win rate, cycle time, top deals, top risks, and team patterns — the same content most QBR decks contain, built without anyone hand-prepping it.
Forecasting tools run the math on what's in the CRM. Olli runs the math on what's actually happening across the deal — including the data the CRM doesn't capture. Olli also proposes plays to fix what's at risk. Forecasting tools don't.
Salesforce shows you what reps typed in. Olli shows you what's actually happening across calls, emails, content engagement, and the patterns across all of it. Risk scoring on every open deal. Patterns rolled up across the team without you running a query.
